RBM comes with a range of Shipped Reports which allows the user to drill in to specific information that is useful to them for their role or at a given time during the cutover.
The same reports can be seen in both the Event Planner and the Runbook Planner. The reports you see will depend on the state of the Event and Runbooks, as some reports are not valid until the Event or Runbooks have been activated.
When the Event and Runbooks are in a state prior to activation, you will see the following reporting views:
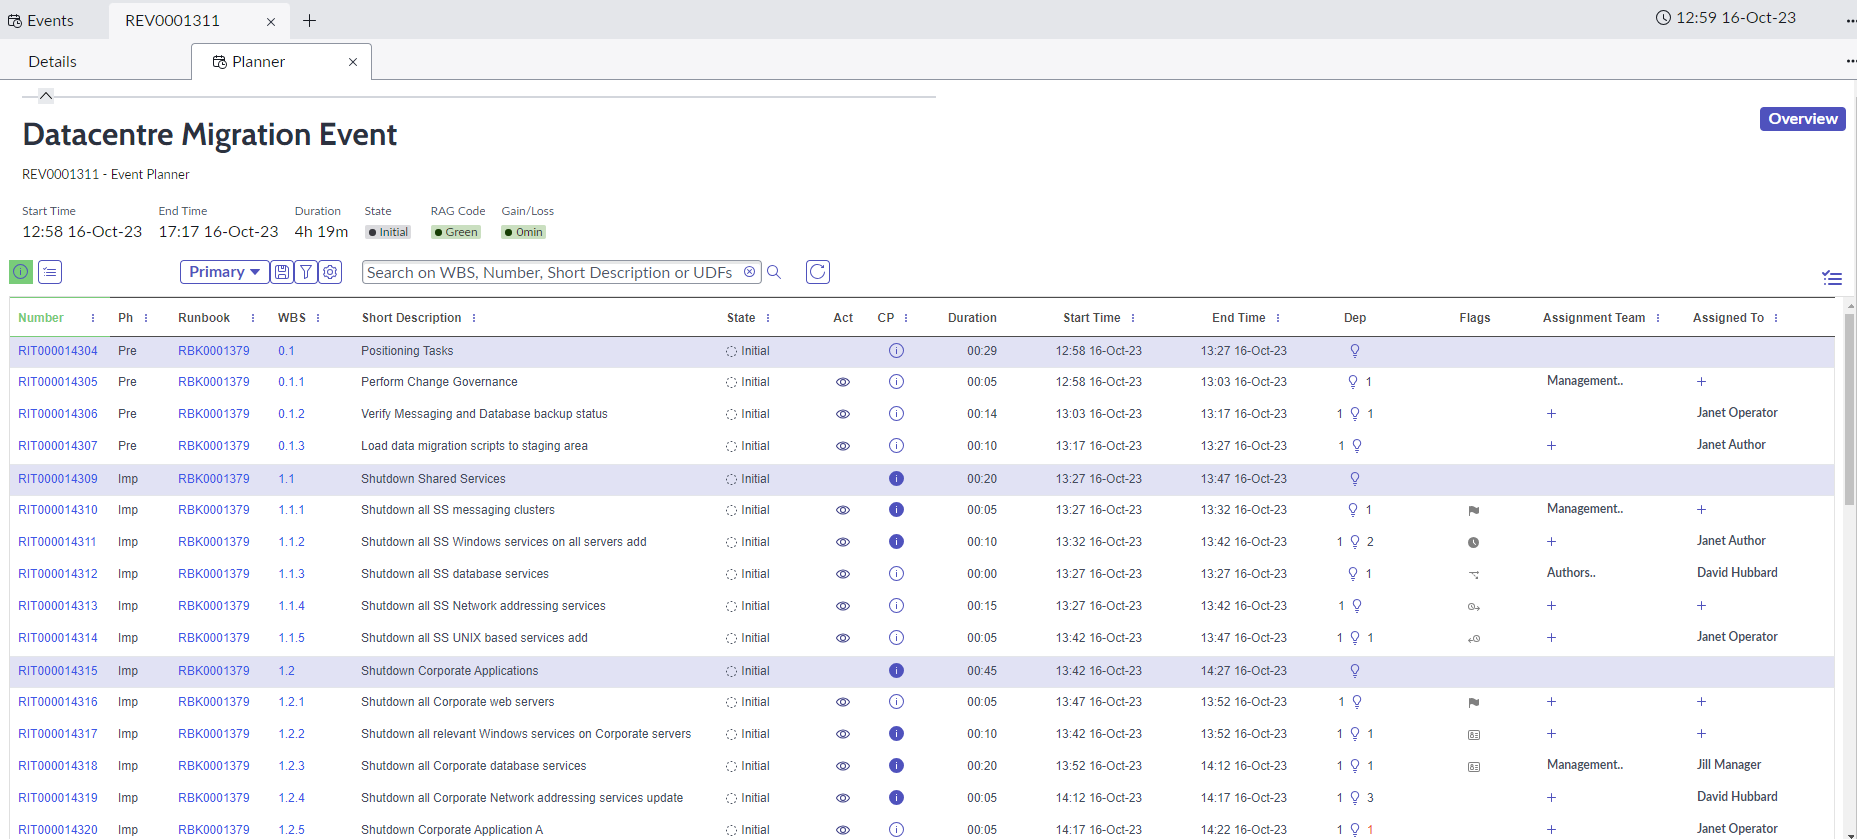
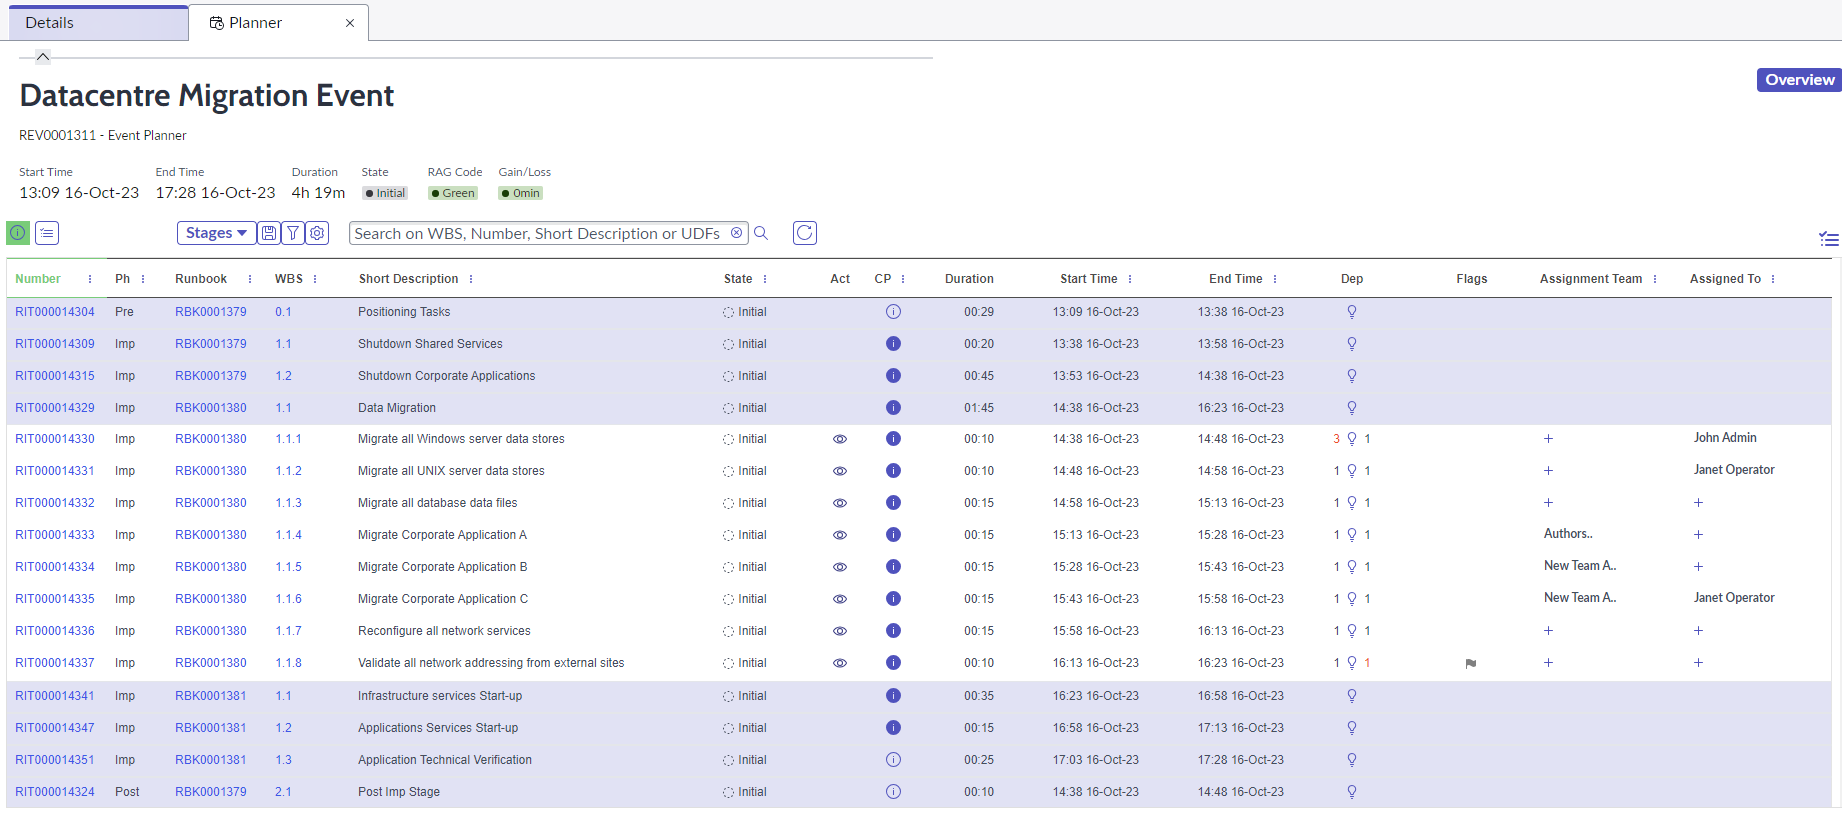
- The Primary Report is the default report and shows all the key information of stages and tasks across either a Runbook or Event, depending on which planner you are on.
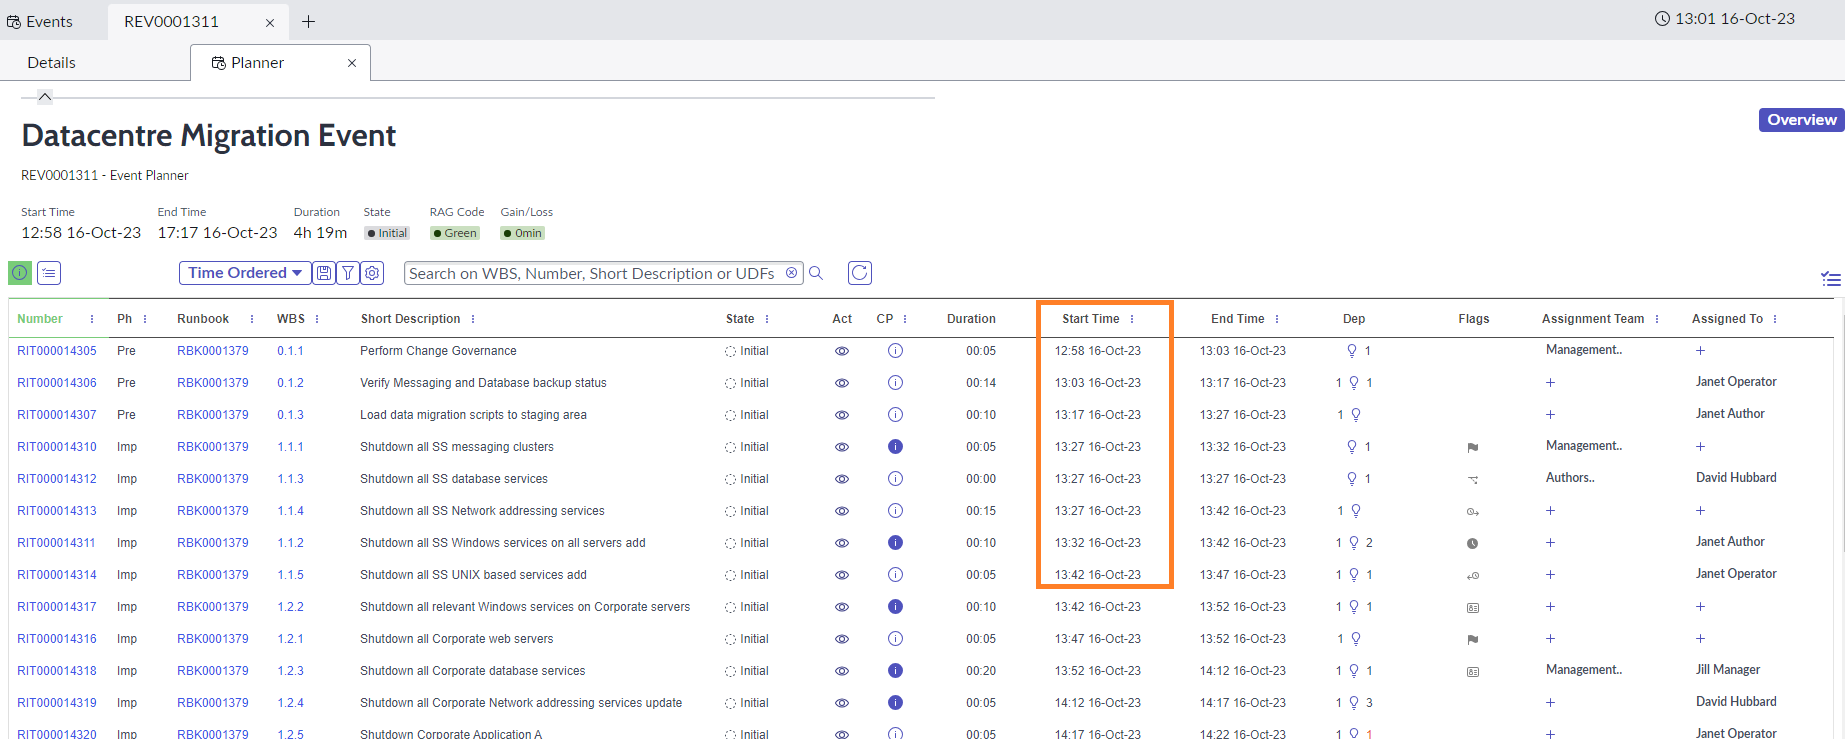
- The Time Ordered Report will list all the tasks in the sequence they are likely to become available depending on forecast start times, across all stages and runbooks, whilst retaining all the key information. This is a dynamic report and will change if the order of tasks change due to task timings, dependencies or to delays when active.
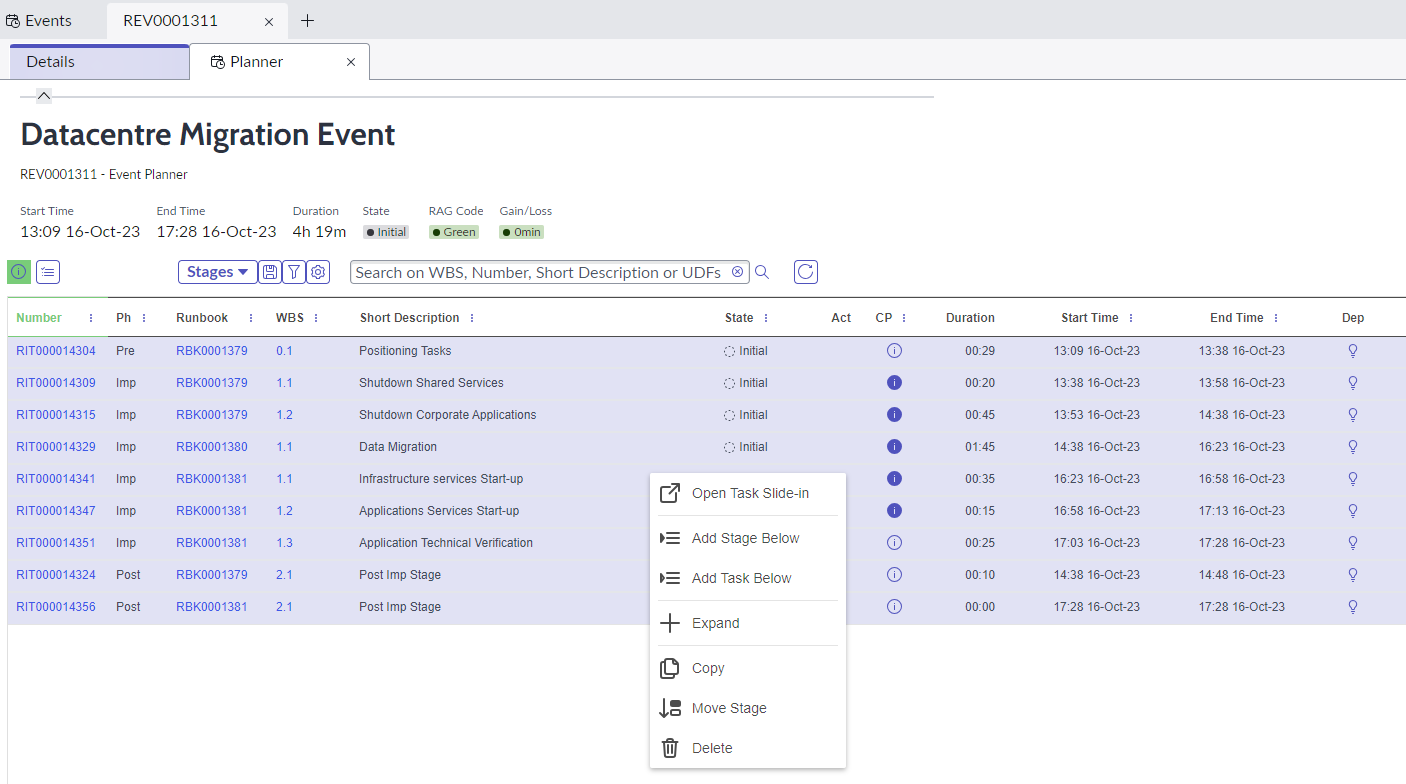
- The Stages Report is useful to see a roundup at the stage level of durations and timings. It can also be useful to check that relevant dependencies are in place by looking at the forecast start times on the stages look right. On this view you can right click on the stage row to expand the stage and view the tasks within
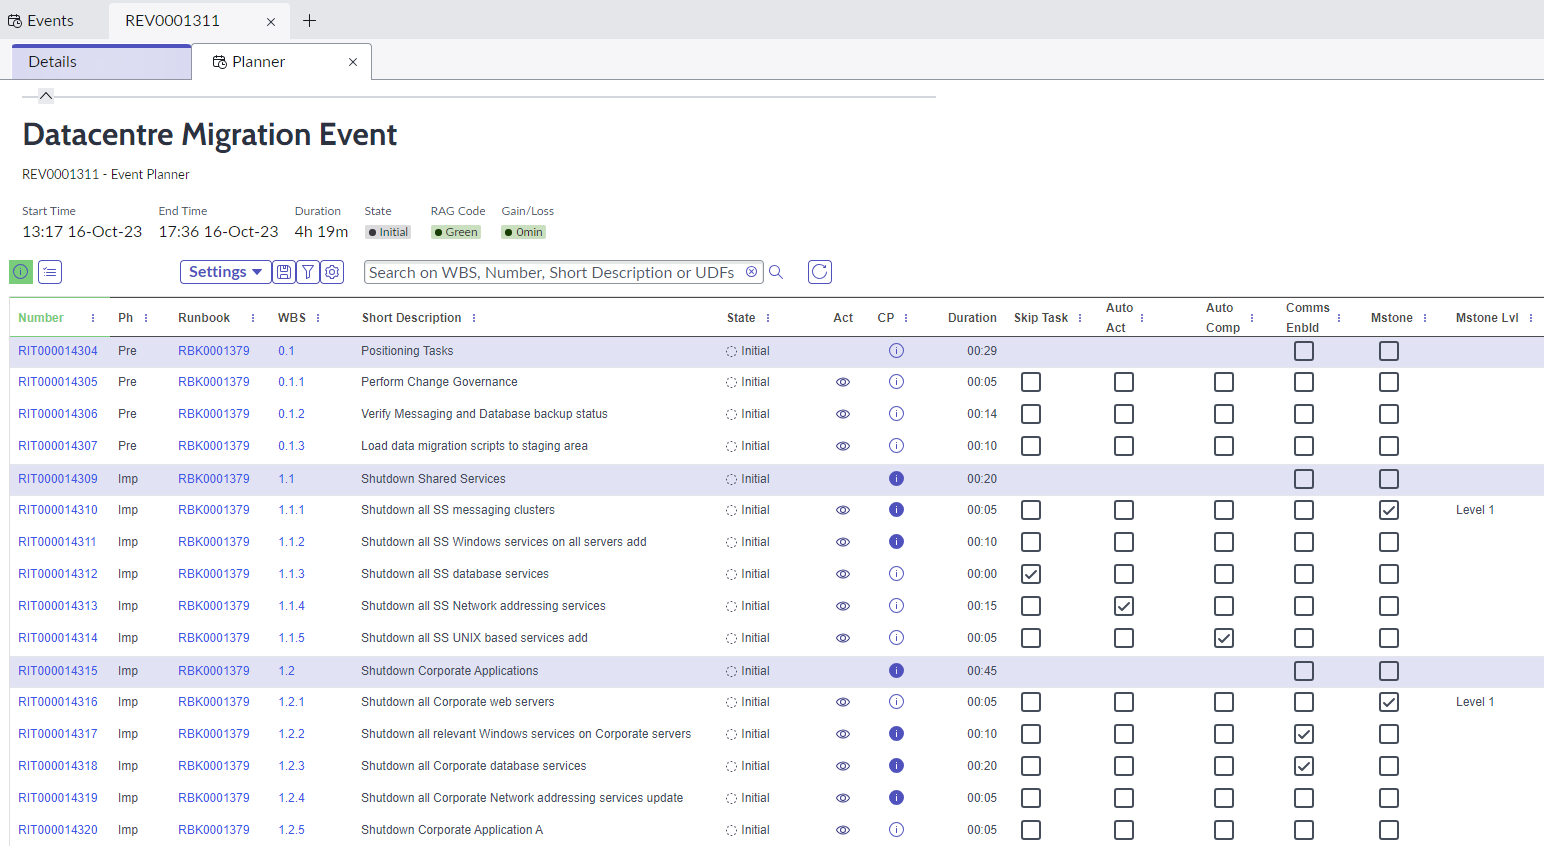
- The Settings Report allows you to quickly edit tasks and add attributes such as Skip Task, Auto Activate, Auto Complete, Enable Comms and add Milestones.
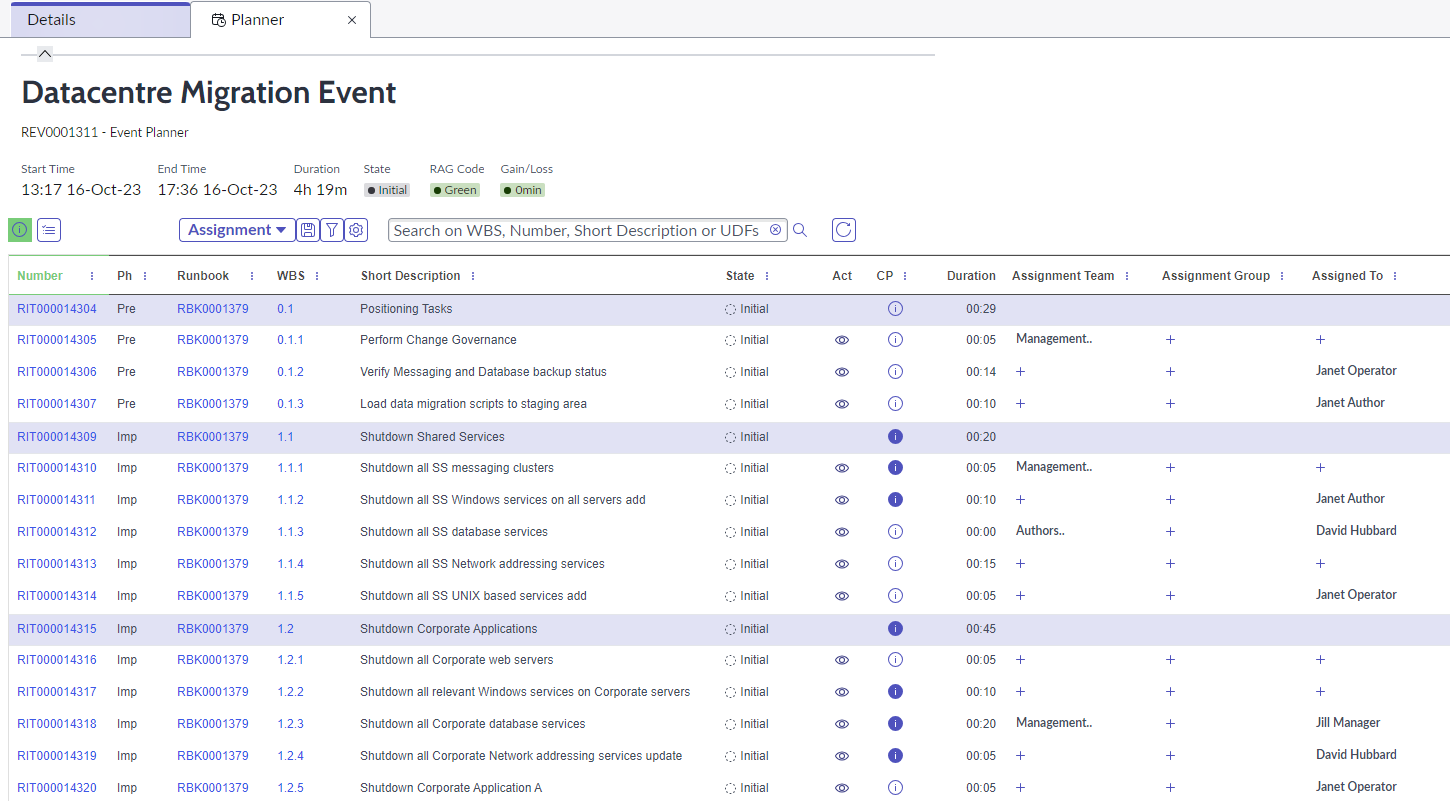
- The Assignment Report helps you focus on task owner or task team ownership, by clicking on the plus sign you can assign a task to any team or user who has been added to the Runbook or Event membership.
- The Dependencies Report shows the detail of predecessor and successors across tasks. By
clicking on a dependency, you may see the associated tasks, if they are available on the page. Any external dependencies ie created across different Runbooks, will be shown in red.
- The Milestone Report shows a list of all tasks or stages which have a milestone flag set and will show the detail of which levels those Milestones have been set at.

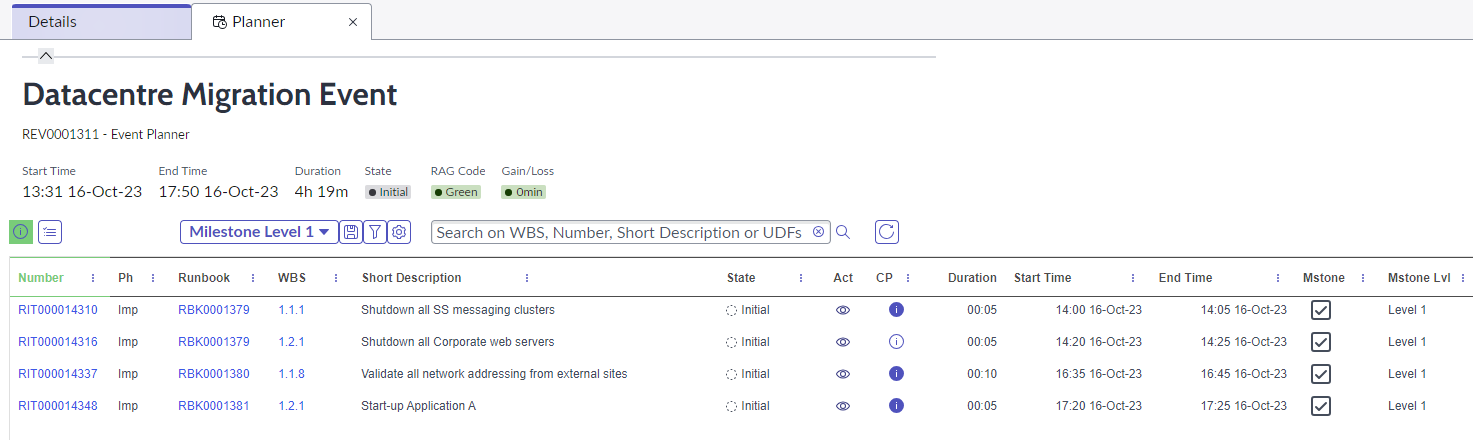
- The Milestone Level 1, 2 and 3 Report shows all tasks or stages which have been set with the relevant level of Milestone flag.
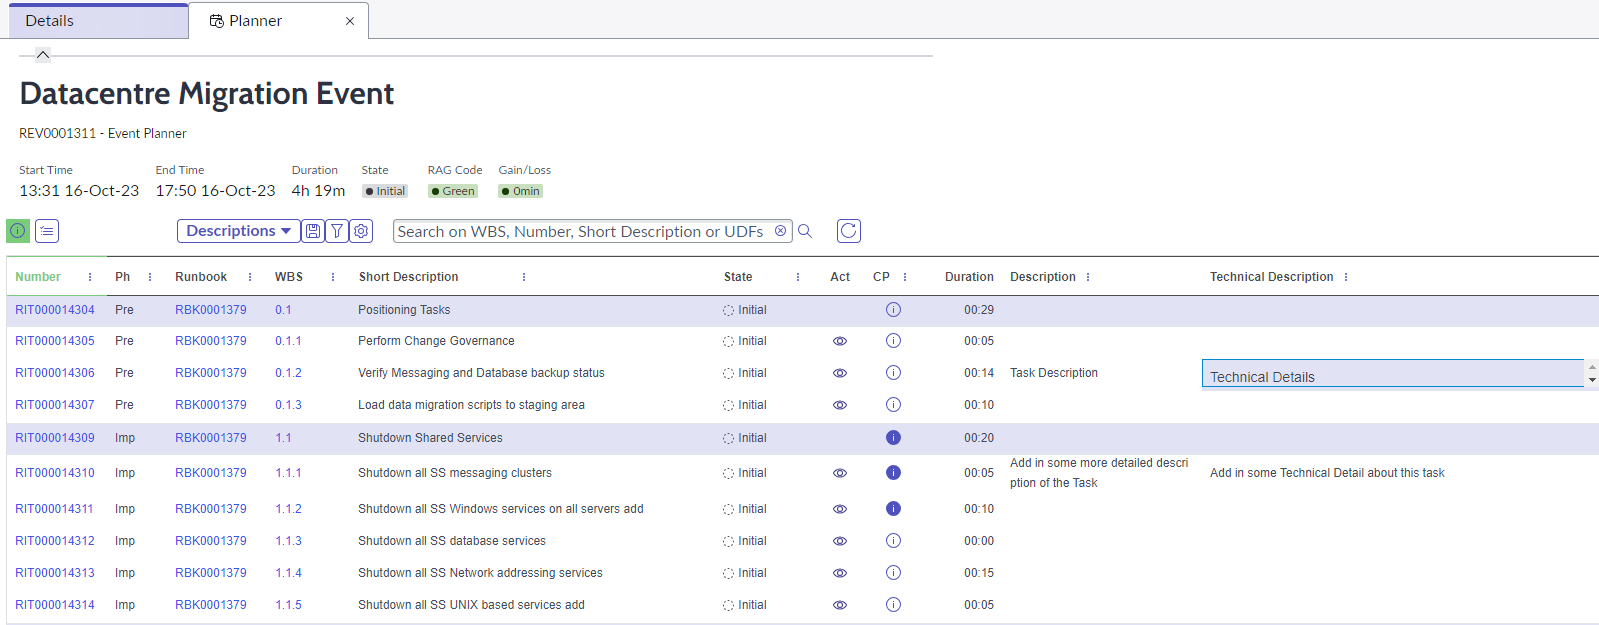
- The Descriptions Report shows the detail of task and stage longer descriptions and technical details and allows the user to update these quickly by double clicking in the relevant fields, and adding or editing the data.
- The Skipped Report lists all tasks which have been flagged as Skipped Tasks. Tasks with this flag will automatically activate and complete with a zero duration, regardless of what planned duration had been assigned to the task on creation. Users can use the Settings Report to quickly tag tasks as Skipped or to remove the flags.

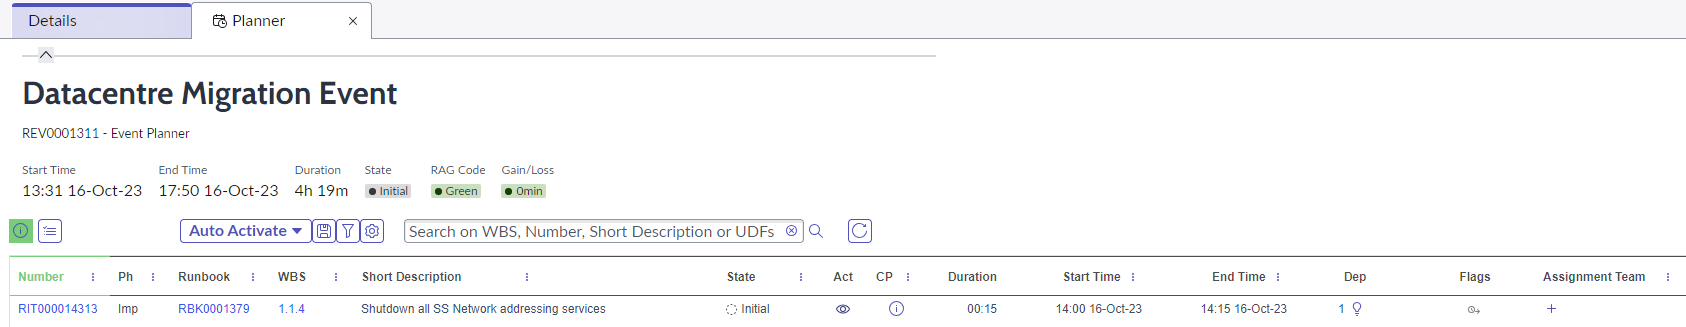
- The Auto Activate Report lists all tasks which have been flagged as Auto Activate, meaning that as soon as all predecessors have been completed, the tasks will automatically become active without manual intervention. Users can use the Settings Report to quickly tag tasks as Auto Activate or to remove the flags.
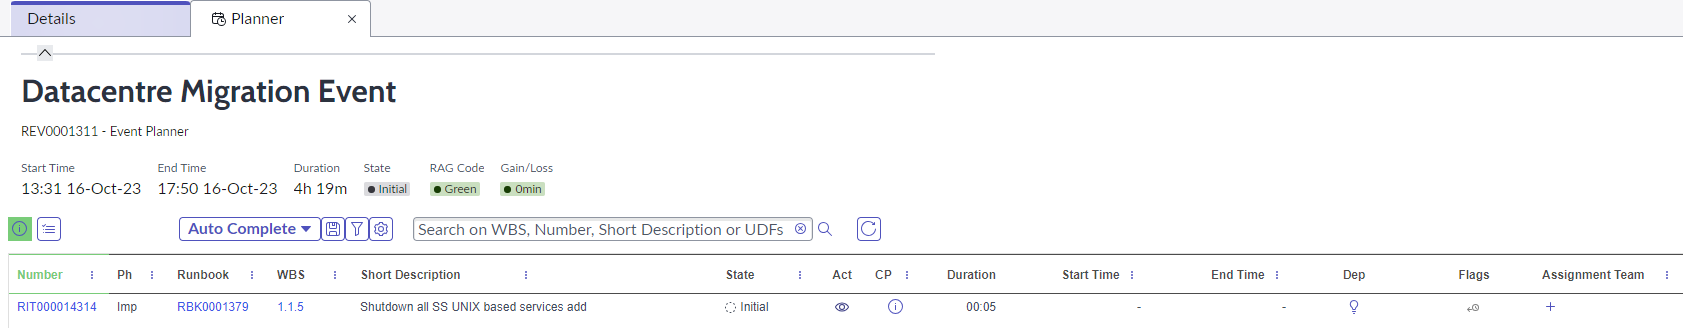
- The Auto Complete Report lists all tasks which have been flagged as Auto Complete, meaning that as soon as the planned duration of the task has elapsed, the tasks will automatically be completed without manual intervention. Users can use the Settings Report to quickly tag tasks as Auto Complete or to remove the flags.
- The Critical Path Report shows all the tasks which are currently on the Critical Path. These are denote by the blue filled in circle under the CP column. This report can dynamically change, if task durations or dependencies are changed, and also during an active event if there are some delays.

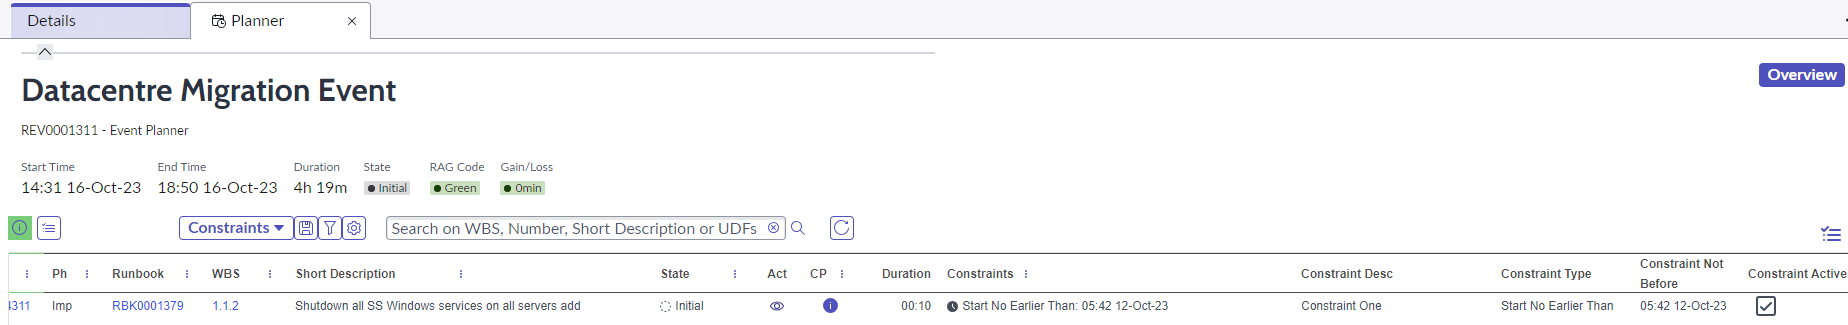
- The Constraint Report will list all tasks which have had a time constraint added, meaning the will not become available until the constraint time has been reached, even if predecessors have been completed. The Constraint Active tick box allows users to toggle the constraint off (but retains the constrain time, in case it is required to be toggled on).
- The User Defined Fields Report shows the six columns of UDFs which can be used to capture information about a task or stage, when perhaps there isn't a specific field in RBM to do this. Double clicking within any of the UDFs allows the user to add data into these fields. In addition, the columns can be filtered on from the three dots on the column header to show specific data held within those fields.

When an Event or Runbook is active, all of the above Reporting views are available, but some additional reports also come into play:
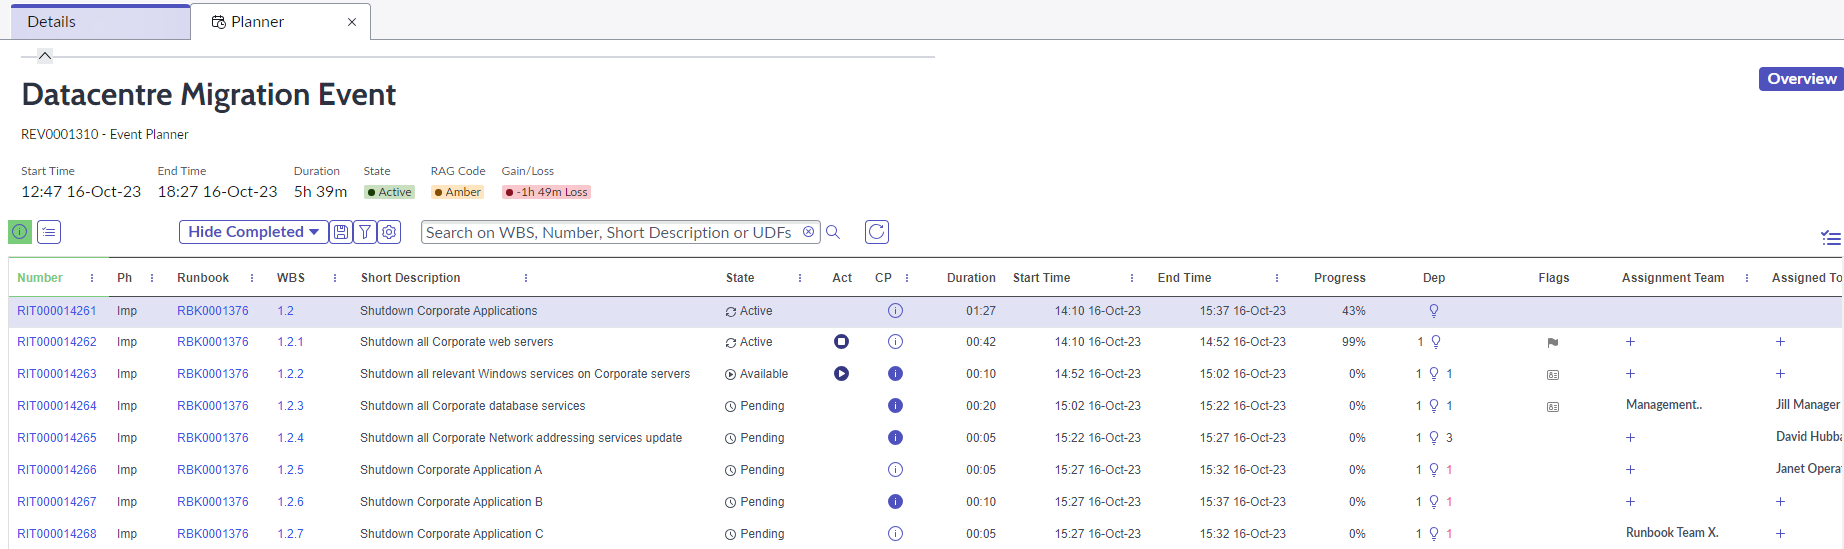
- The Hide Completed Report allows the user to remove all completed tasks from their view. Only tasks which are available, active, suspended or pending will show in this view. with all the key information. Tasks can be activated and completed from this view.
- The Active Report will only show tasks which are currently active, allowing the user to drill into the tasks in this state and complete from this view.

- The Active/Available Report will show all tasks which are currently active and available, allowing the user to drill into all tasks in this state and activate or complete the tasks from this view.

- The Active/Available/Suspended Report, shows all tasks in this state and allows the user to activate and complete tasks from this report, but also highlighting ay tasks which are suspended.

- The Available Report shows all tasks available for activation and allows users to start tasks from this view.
All of the reports above are dynamic, so will update depending on tasks states, as tasks are activated and completed.
In addition, users can filter on additional columns to reduce the lust further, to include tasks assigned to them or to their team, for example.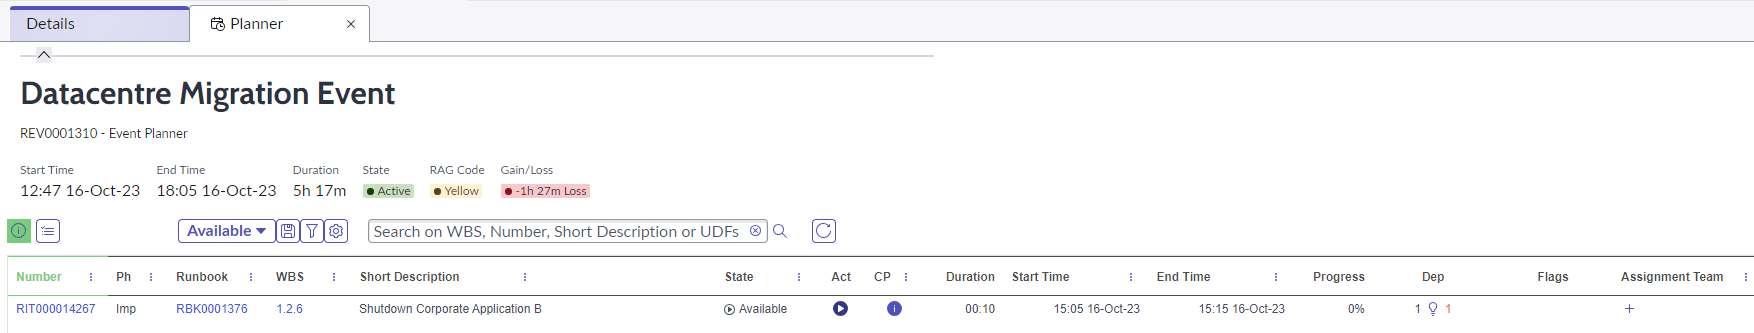
- The Planned v Actual Report shows some additional timings on the tasks which are useful to monitor progress and keep an eye on any delays. The Planned times are times which are set when the overall Event was approved and are the benchmark for comparing task timings as the Runbooks and Event progresses. Once tasks are activated and then completed, the actual times and durations will be populated.

Included in this view are additional columns which flag any delays and lateness which could impede progress
- Delta - this is the difference between the Planned and Actual Duration
- Late to Start - this column flags with an orange circle if the task has been waiting activation for 5 mins or more and also shows how long it has been available. If a task is available for a long period of time, this could be pushing out the times of other dependent tasks and possibly impacting the forecast end time of the Runbook or the Event
- Late to Finish - this columns flags with an orange circle if a task has run beyond it's planned duration, potentially pushing out the times of dependent tasks and the forecast end times of the Runbook and Event. The column will also show how long the task has been running. That becomes fixed once the task has been completed.
- The Late Report shows all tasks which are Late to start with the Late to Start column added to highlight this. The Duration Delta is also included in this report.

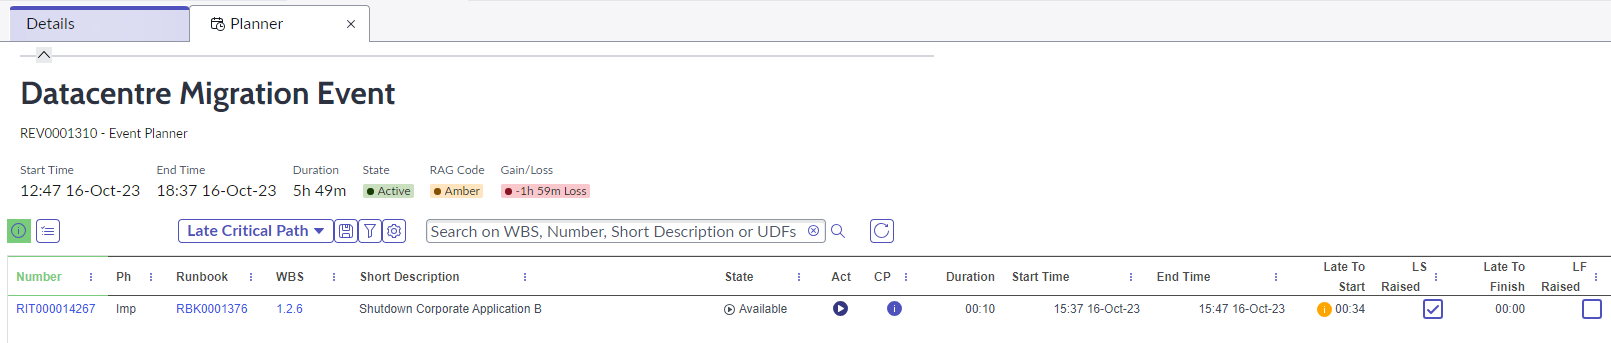
- The Late Critical Path Report shows all Critical Tasks which are available or active and which are currently flagged as Late.